Laser sources for photoacoustic imaging
Photoacoustic imaging is one of the fastest-growing research areas
of non-invasive, high-resolution and high-contrast visualization of both superficial and deep tissues.
This method has a number of advantages over widely used conventional research and diagnostic methods as unlike X-ray, it does not use hazardous irradiation and has a significantly higher imaging resolution compared to conventional ultrasound. Photoacoustic imaging is proven to be very effective in diagnosing breast tumors, skin cancer, thyroid nodules, osteoarthritis and rheumatoid arthritis, early diagnosis of blood vessel disorders and many more. Photoacoustic imaging can also be used for visualization of non-living objects, such as nondestructive inspection of the internal structure and property changes of composite materials and food inspection.
Photoacoustic imaging employs the physical property of molecules to briefly heat up and cool down while absorbing a short pulse of light
(couple of nanoseconds) of a certain wavelength. While heating up, molecules expand and while cooling down, they contract. This creates an ultrasound wave which can be captured by ultrasound transducers enabling the ability to locate the origin of sound. The penetration of light into tissue depends on the tissue properties and the pulse energy of the light. Moreover, different chromophores in the tissue can absorb light of different wavelengths, thus giving functional visual information.
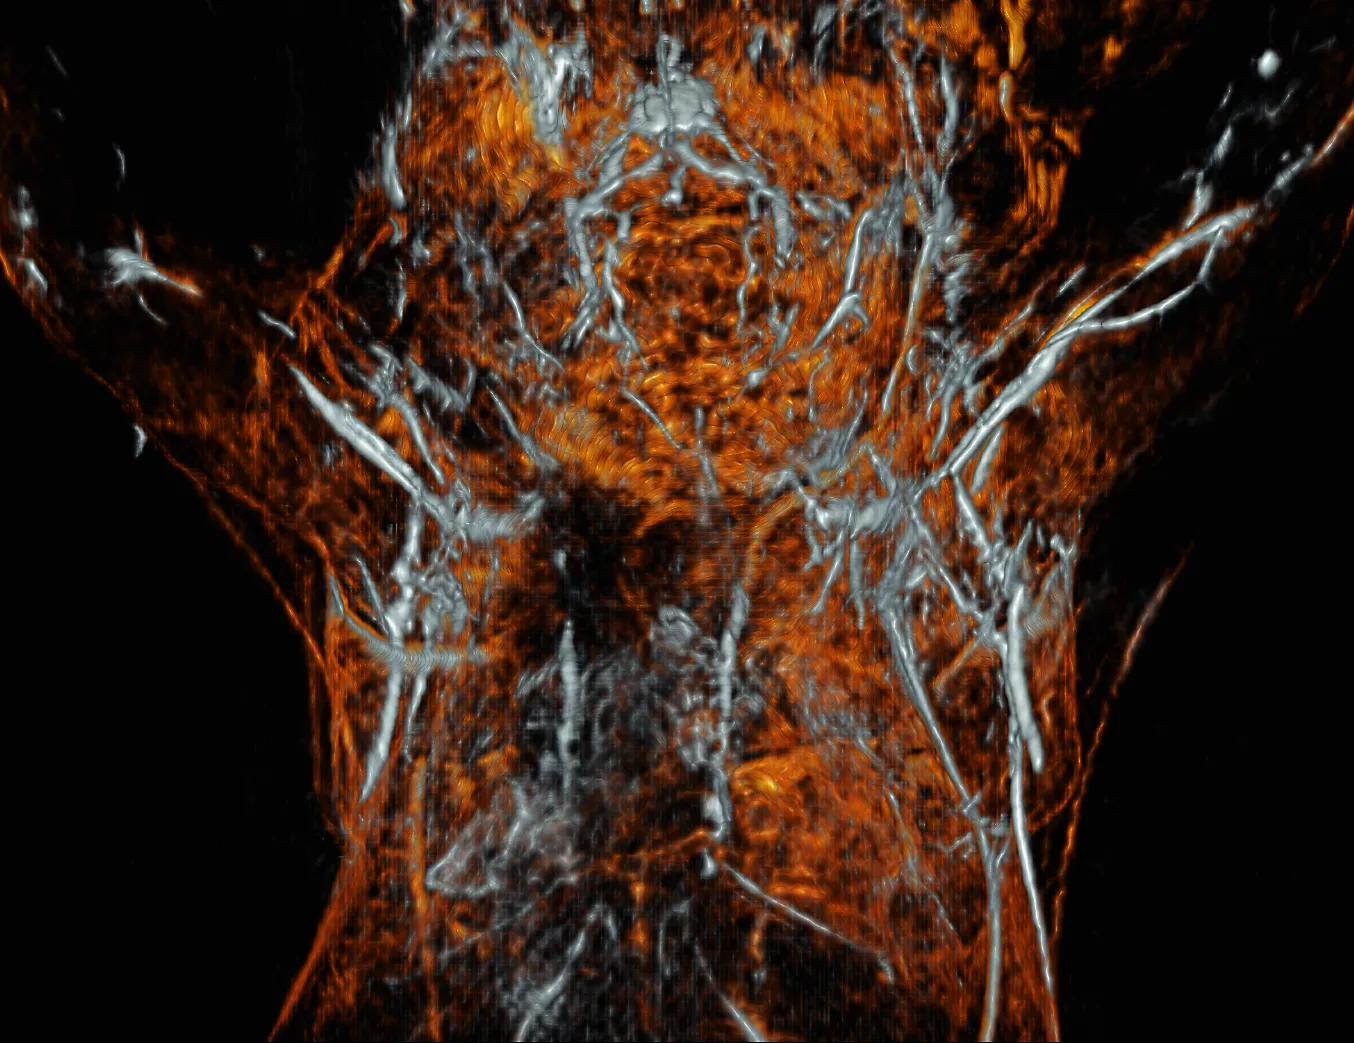
Photoacoustic image of the upper torso and brain of a female mouse.
Courtesy of PhotoSound Technologies, Inc.
Comparison table of photoacoustic imaging sources
| Model | Available output wavelengths | Pulse duration 1) | Max repetition rate | Max pulse energy |
|---|---|---|---|---|
| Diode pumped laser source | ||||
| PhotoSonus X | 660 – 1300 nm (signal) 1065 – 2600 nm (idler) | 2 – 5 ns | 100 Hz | 90 mJ |
| Mobile flashlamp pumped laser source | ||||
| PhotoSonus M | 660 – 1320 nm (signal) 330 – 659 nm (SH) 1065 – 2300 nm (idler) | 3 – 5 ns | 20 Hz | 180 mJ |
| PhotoSonus M+ | 660 – 1064 nm (signal) 2) 330 – 530 nm (SH) 3) 1065 – 2300 nm (idler) | 3 – 5 ns | 10 Hz | 250 mJ |
| Table-top flashlamp pumped laser source | ||||
| PhotoSonus T | 660 – 1320 nm (signal) 330 – 659 nm (SH) 1065 – 2300 nm (idler) | 3 – 5 ns | 20 Hz | 150 mJ |
| PhotoSonus T+ | 660 – 1064 nm (signal) 2) 330 – 530 nm (SH) 3) 1065 – 2300 nm (idler) | 3 – 5 ns | 10 Hz | 230 mJ |
| Model | Available output wavelengths | Pulse duration 1) | Max repetition rate | Max pulse energy |
|---|
- FWHM measured with photodiode featuring 1 ns rise time and 300 MHz bandwidth oscilloscope.
- Optional signal extended range: 660 – 1320 nm.
- When extended signal range is selected, wavelength range is 330 – 659 nm.
Products range
Sum frequency generation spectroscopy systems
Vibrational Spectroscopy (SFG-VS) is powerful and versatile method for in-situ investigation of surfaces and interfaces. In SFG-VS experiment a pulsed tunable infrared IR (ωIR) laser beam is mixed with a visible VIS (ωVIS) beam to produce an output at the sum frequency (ωSFG = ωIR + ωVIS). SFG is second order nonlinear process, which is allowed only in media without inversion symmetry.
At surfaces or interfaces inversion symmetry is necessarily broken, that makes SFG highly surface specific. As the IR wavelength is scanned, active vibrational modes of molecules at the interface give a resonant contribution to SF signal. The resonant enhancement provides spectral information on surface characteristic vibrational transitions.
Vibrational sum frequency generation (SFG) spectroscopy holds several important advantages over traditional spectroscopy methods for the molecular level analysis of interfaces, including surface sensitivity, vibrational specificity, and the possibility to extract detailed information on the ordering and orientation of molecular groups at the interface by analysis of polarization-dependent SFG spectra.
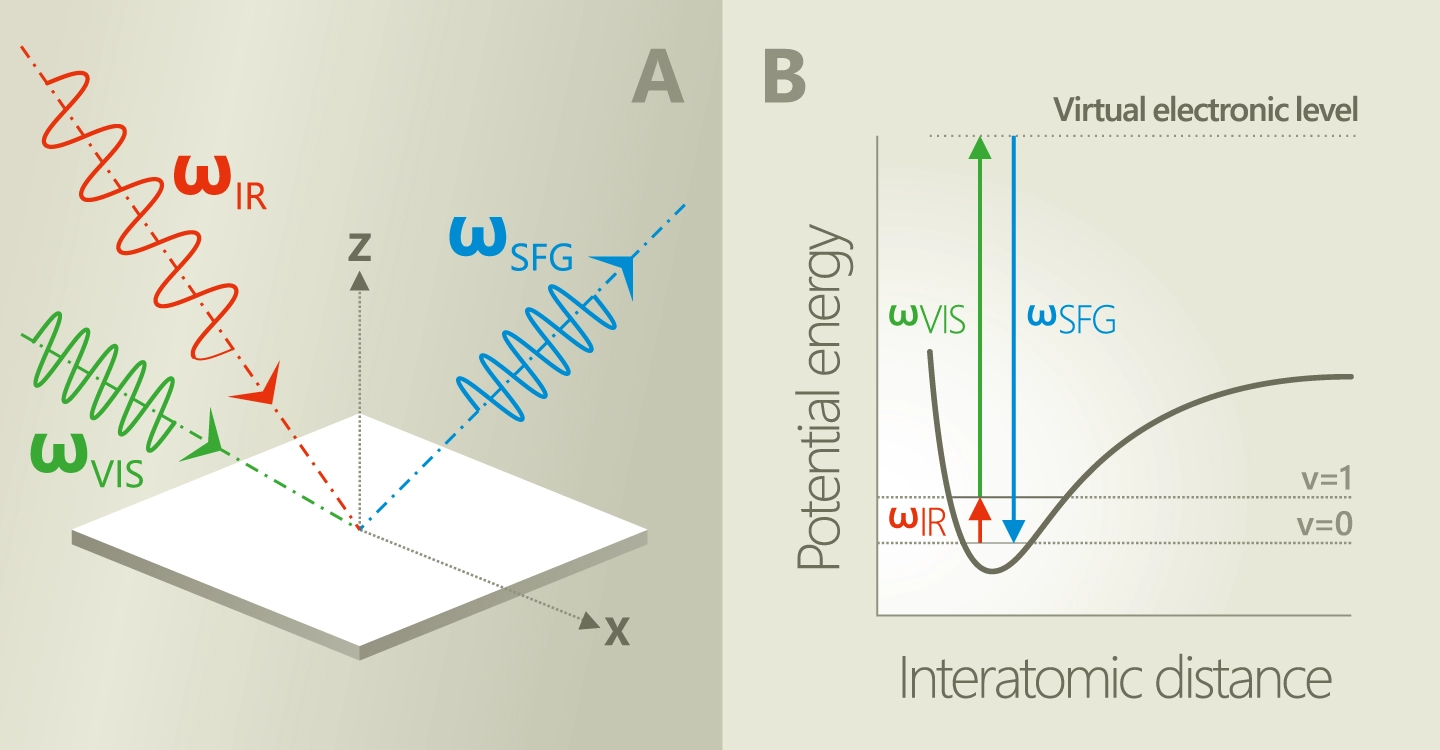
SFG signal generation diagram (a) and the molecular energy level diagram for the SFG process (b).
Narrowband picosecond scanning SFG spectrometer
In order to get SFG spectrum during measurement wavelength of narrowband mid-IR pulse is changed point-by-point throughout the range of interest. Narrowband SFG signal is recorded by the time-gated photomultiplier. Energy of each mid-IR, VIS and SFG pulse is measured. After the measurement, the SFG spectrum can be normalised according to IR and VIS energy. Spectral resolution is determined by the bandwidth of the mid-IR light source. The narrower mid-IR pulse bandwidth, the better the SFG spectral resolution. Separate vibrational modes are excited during the measurement.
Broadband femtosecond SFG spectrometer
A broadband mid‑IR pulse is mixed with a narrowband VIS pulse, producing a broadband SFG spectrum that is recorded using a monochromator and a sensitive CCD camera. The full spectrum is acquired simultaneously by integrating the signal over time. The spectral resolution is determined by the bandwidth of the VIS pulse and by the monochromator–camera combination. The narrower the bandwidth of VIS pulse, the better the SFG spectral resolution.
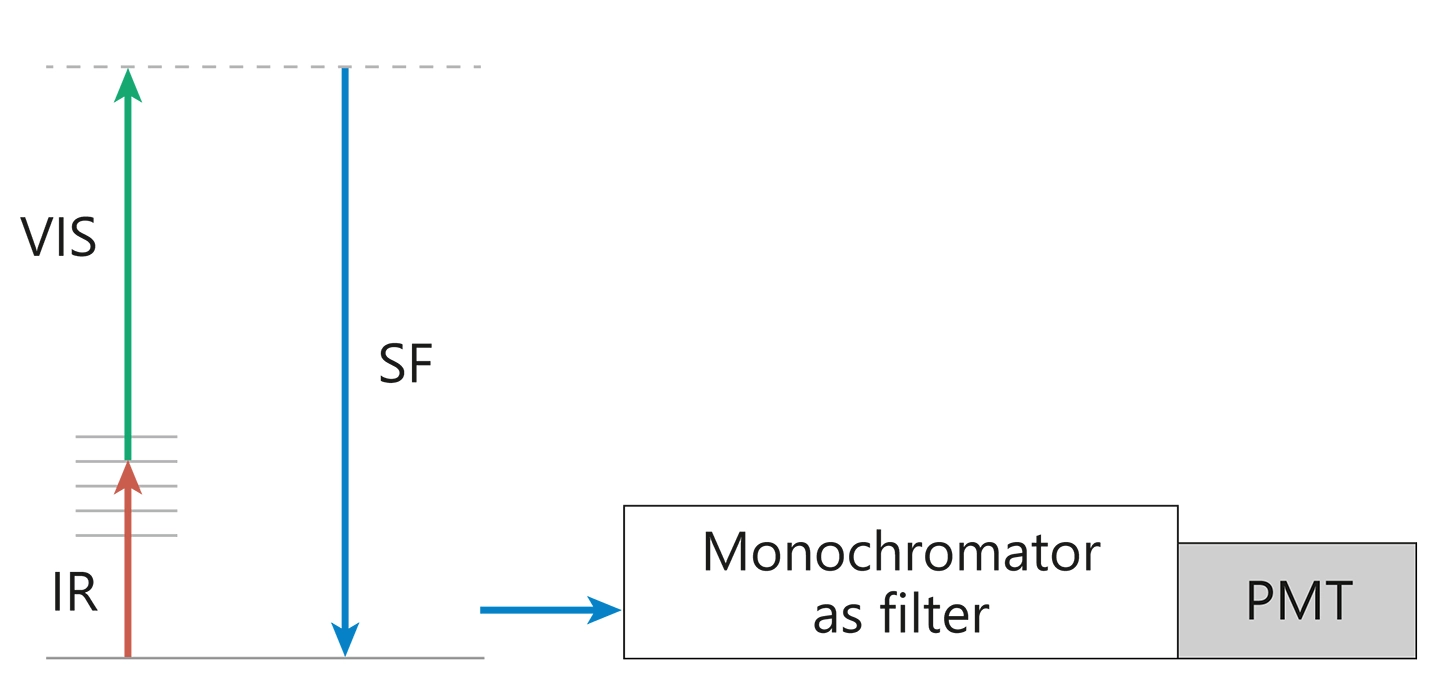
Diagram of Narrowband picosecond scanning SFG spectrometer.
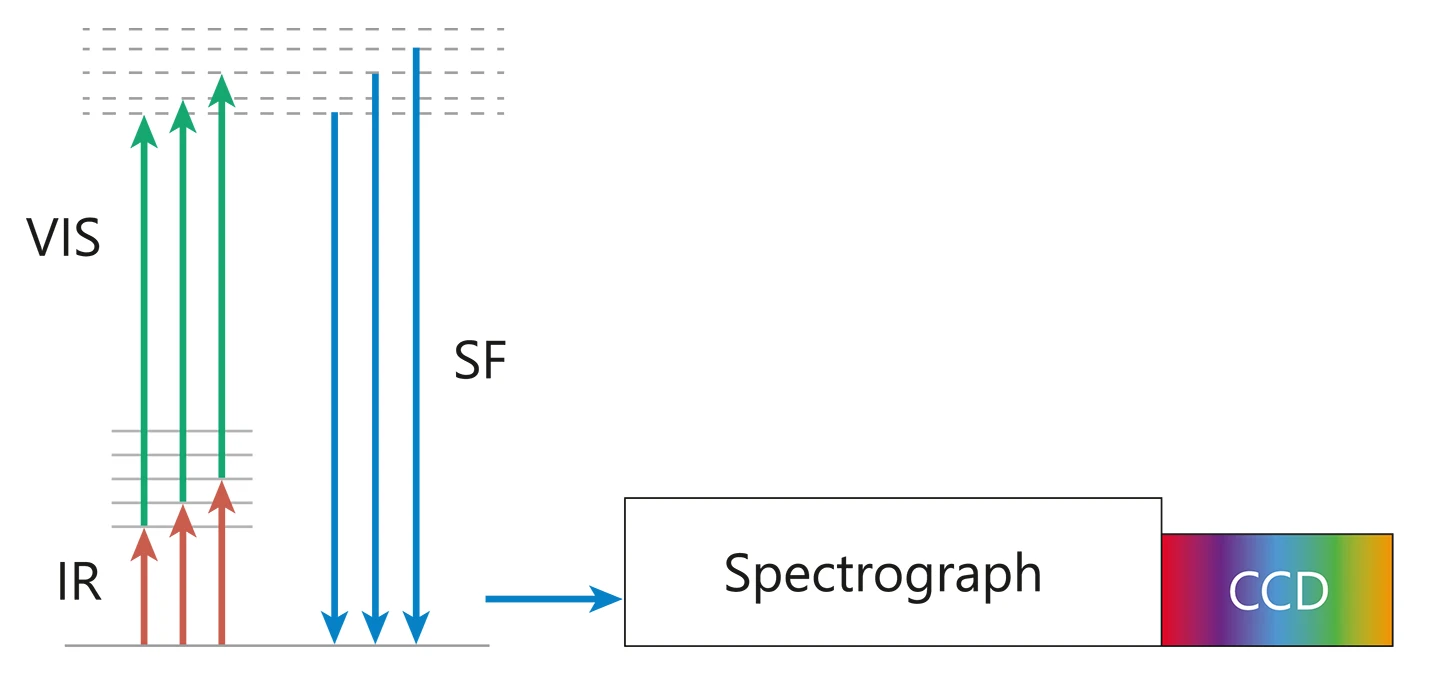
Diagram of Broadband femtosecond SFG spectrometer.
Comparison of different SFG spectrometres
| Narrowband Picosecond Scanning Spectrometer | Broadband Femtosecond High Resolution Spectrometer |
|---|---|
| Narrowband mid-IR excitation, only one band is excited. Coupled states can be separated. | Simultaneous exsitation and recording of broad vibration spectrum with high resolution. |
| High mid-IR pulse energy. Less influence of IR absorbtion in the air. | High mid-IR intensity at low pulse energy – suitable for biological or other water containing samples. |
| No reference spectrum needed, IR energy measured at each spectral point. | Optically coupled IR and VIS channels. Reduced complexity and increased stability of the system. |