Scanning SFG Spectrometer
Picosecond Scanning Sum Frequency Generation (SFG) Vibrational Spectrometer
In order to get SFG spectrum during measurement wavelength of narrowband mid-IR pulse is changed point-by-point throughout the range of interest. Narrowband SFG signal is recorded by the time-gated photomultiplier.

Advantages
- Sensitive and selective to the orientation of molecules in the surface layer
- Intrinsically surface specific
- Selective to adsorbed species
- Sensitive to submonolayer of molecules
- Applicable to all interfaces accessible to light
- Nondestructive
- Capable of high spectral and spatial resolution
Applications
- Investigation of surfaces and interfaces of solids, liquids, polymers, biological membranes and other systems
- Studies of surface structure, chemical composition and molecular orientation
- Remote sensing in hostile environment
- Investigation of surface reactions under real atmosphere, catalysis, surface dynamics
- Studies of epitaxial growth, electrochemistry, material and environmental problems
Sum Frequency Generation Vibrational Spectroscopy
Sum Frequency Generation Vibrational Spectroscopy (SFG-VS) is powerful and versatile method for in-situ investigation of surfaces and interfaces. In SFG-VS experiment a pulsed tunable infrared IR (ωIR) laser beam is mixed with a visible VIS (ωVIS) beam to produce an output at the sum frequency (ωSFG = ωIR + ωVIS). SFG is second order nonlinear process, which is allowed only in media without inversion symmetry. At surfaces or interfaces inversion symmetry is necessarily broken, that makes SFG highly surface specific. As the IR wavelength is scanned, active vibrational modes of molecules at the interface give a resonant contribution to SF signal. The resonant enhancement provides spectral information on surface characteristic vibrational transitions.
Vibrational sum frequency generation (SFG) spectroscopy holds several important advantages over traditional spectroscopy methods for the molecular level analysis of interfaces, including (i) surface sensitivity, (ii) vibrational specificity, and (iii) the possibility to extract detailed information on the ordering and orientation of molecular groups at the interface by analysis of polarization-dependent SFG spectra.
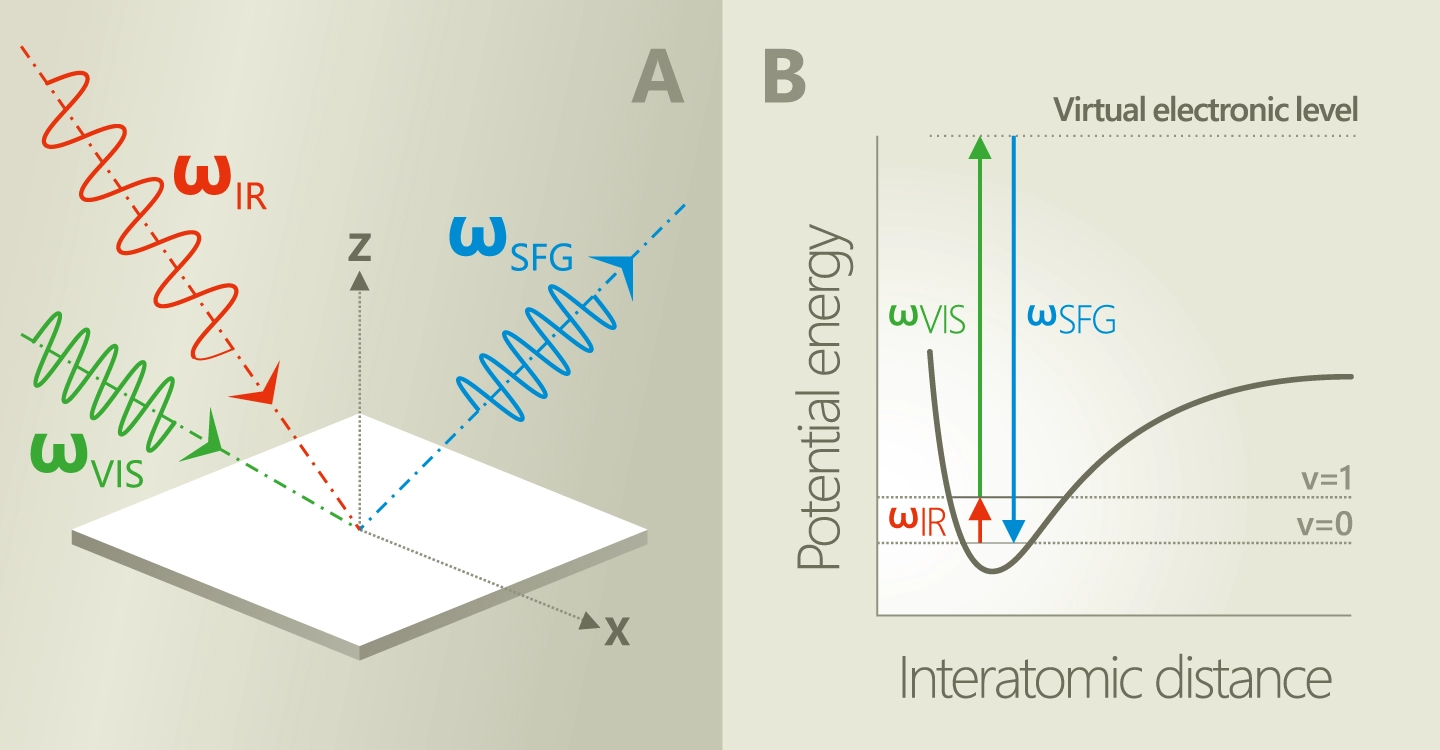
SFG signal generation diagram (a) and the molecular energy level diagram for the SFG process (b).
Spectra examples
Comparison of Narrowband and Broadband SFG Spectrometers
Narrowband picosecond scanning SFG spectrometer
In order to get SFG spectrum during measurement wavelength of narrowband mid-IR pulse is changed point-by-point throughout the range of interest. Narrowband SFG signal is recorded by the time-gated photomultiplier. Energy of each mid-IR, VIS and SFG pulse is measured. After the measurement, the SFG spectrum can be normalised according to IR and VIS energy. Spectral resolution is determined by the bandwidth of the mid-IR light source. The narrower mid-IR pulse bandwidth, the better the SFG spectral resolution. Separate vibrational modes are excited during the measurement.
Broadband femtosecond SFG spectrometer
A broadband mid-IR pulse is mixed with a narrowband VIS pulse. The result is broadband SFG spectrum which is recorded using a monochromator and a sensitive CCD camera. The full spectrum is acquired simultaneously by integrating signal over time. Spectral resolution is determined by the bandwidth of the VIS pulse and on the monochromator-camera combination. The narrower the bandwidth of VIS pulse, the better the SFG spectral resolution.
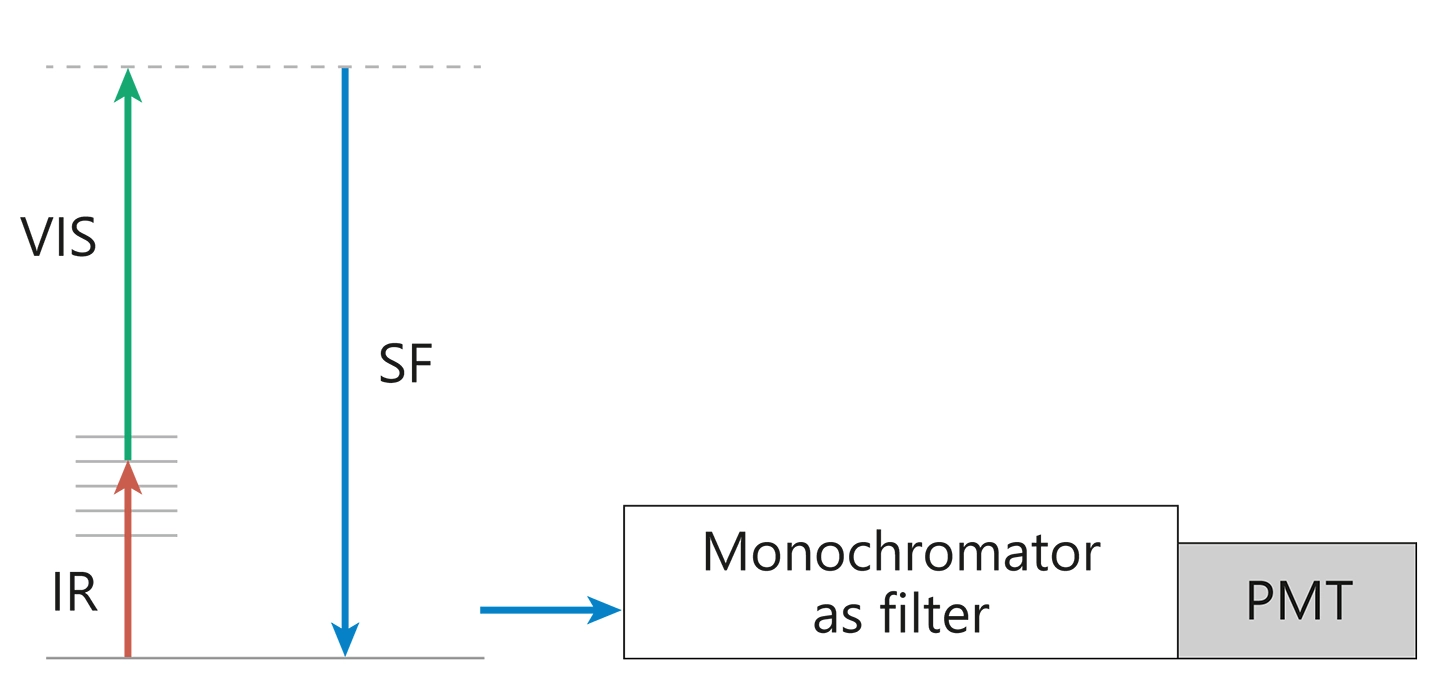
Diagram of Narrowband picosecond scanning SFG spectrometer.
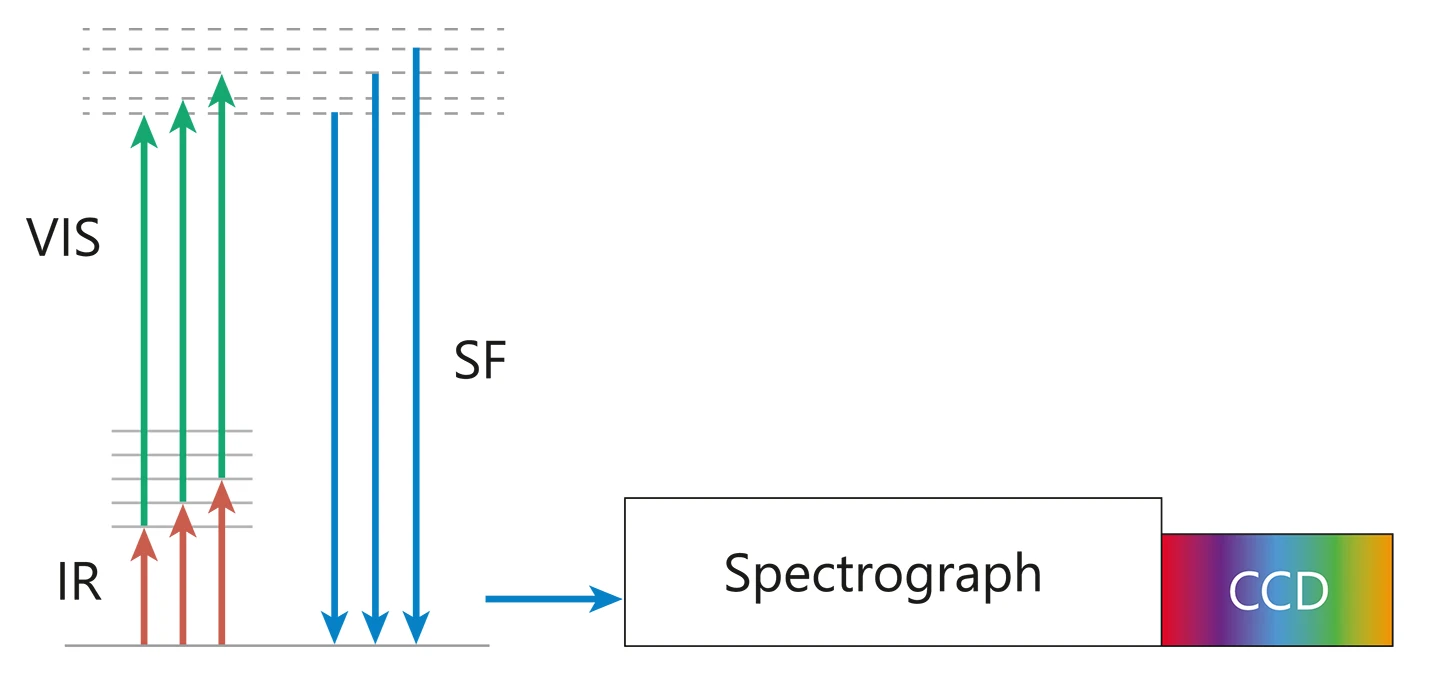
Diagram of Broadband femtosecond SFG spectrometer.
Comparison of different SFG spectrometres
| Narrowband Picosecond Scanning Spectrometer | Broadband Femtosecond High Resolution Spectrometer |
|---|---|
| Narrowband mid-IR excitation, only one band is excited. Coupled states can be separated. | Simultaneous exsitation and recording of broad vibration spectrum with high resolution. |
| High mid-IR pulse energy. Less influence of IR absorbtion in the air. | High mid-IR intensity at low pulse energy – suitable for biological or other water containing samples. |
| No reference spectrum needed, IR energy measured at each spectral point. | Optically coupled IR and VIS channels. Reduced complexity and increased stability of the system. |
Spectra examples
Features and Design
The SFG spectrometer developed by Ekspla engineers is a nonlinear spectrometry instrument, convenient for everyday use. Ekspla manufactures SFG spectrometers, which are used by chemists, biologists, material scientists, and physicists. The spectrometer has many features that help to set up measurements and to make successful vibrational spectroscopy studies. For chemical and biochemical laboratories, this makes the Ekspla SFG spectrometer a reliable workhorse with a broad spectral region, automatically tuned from 667 to 4300 cm‑1, a high spectral resolution (5 cm‑1), and easily controlled adjustment of polarisation optics.

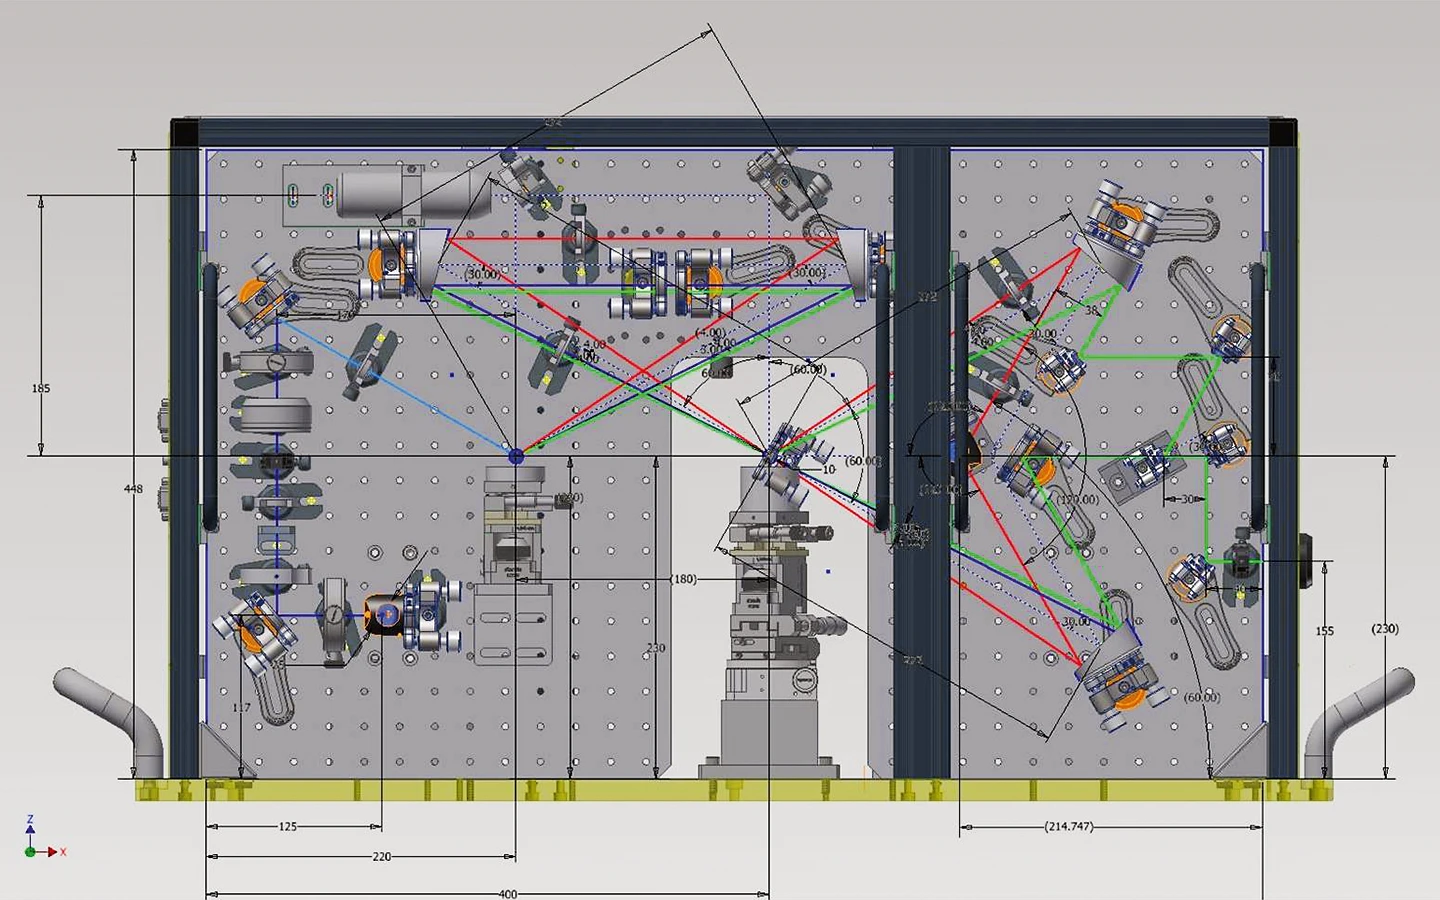
Schematic layout of SFG Classic spectrometer.
The new SFG classic spectrometer consist of two units: laser light source PT501 and spectroscopy module.
The Ekspla SFG system is based on a mode-locked Nd:YAG laser with a 29 ps pulse duration, 100 Hz repetition rate. The VIS channel of the SFG spectrometer consists of part of a laser output beam, usually with doubled frequency (532 nm) up to 0.5 mJ. The main part of the laser radiation goes to an optical parametric generator (OPG) with a difference frequency generation (DFG) extension. The IR channel of the spectrometer is pumped by the DFG output beam with energy in the range of ~40 – 200 μJ. Infrared light can be tuned in a very broad spectral range from 2.3 up to 16 μm. The bandwidth is 4 cm-1 and it is one of the main factors of SFG spectrometer spectral resolution. The second beam (VIS) is also narrowband at <2 cm‑1.
The spectrometer detection system has a temporal gate. It reduces noise collection and ambient light influence, which allows the spectrometer to be used even in a brightly illuminated room. The spectrometer does not have any acoustic noise because the laser is pumped by diodes. The spot size of the IR beam is adjustable. In this way, the appropriate energy density is achieved to avoid damaging the sample. Spectrum scanning, polarisation control and VIS beam attenuation are controlled from a computer. The spectrometer has a motorized polarisation switch for the IR, optionaly for the VIS, and optionaly the generated SFG light beams . Special detectors continuously monitor the energy of the VIS and mid-IR laser pulses, so IR energy is recorded at each measurement point. This makes it easy to normalize the resulting SFG vibrational spectrum.

Picosecond Scanning Sum Frequency Generation (SFG) Vibrational Spectrometer.
System Components
- Picosecond mode-locked Nd:YAG laser
- Multichannel beam delivery unit
- Picosecond optical parametric generator
- Spectroscopy module
- Monochromator
- PMT based signal detectors
- Data acquisition system
- Dedicated LabView® software package for system control
A large sample compartment can be customised and enables the use of various extensions and additional instruments for simultaneous control of the sample conditions, including a Langmuir-Blodgett trough for air/water and lipid/air interface studies, temperature and humidity-controlled cells, and other instruments.

Standard layout of the vertically-arranged sample compartment of the SFG spectrometer.
The spectral range of the infrared beam determines available vibrational spectra and the spectral range of the spectrometer.
The main modification of the spectrometer enables a spectral range of 667 to 4,300 cm‑1.
The spectrometer is safe to use: all high energy pulsed beams are enclosed. In addition, the sample area also has a special cover. During the measurements, it is possible to close the sample compartment so that radiation cannot penetrate outside. The automatic change of polarisation and energy attenuation makes it possible to perform measurements without opening the spectrometer. Laser safety precautions are required only for the alignment of the laser beams on the studied surface.